Ctrl+K
 - Home

For users

  • Getting Started
    • Why UXarray?
    • Installation
    • UXarray in 10 Lines
    • Frequently Asked Questions
  • User Guide
    • Terminology
    • Conventions
    • Supported Models & Grid Formats
    • Data Structures
    • Loading Data Using Dask
    • Plotting
    • Plotting with Matplotlib and Cartopy
    • Advanced Plotting Techniques
    • Subsetting
    • Cross-Sections
    • Zonal Averaging
    • Remapping
    • Topological Aggregations
    • Weighted Mean
    • Vector Calculus
    • Tree Structures
    • Face Area Calculations
    • Dual Grid Construction
    • Reading Structured Grids
    • Constructing a Grid from Points
    • Working with HEALPix Data
    • Compatibility with HoloViz Tools
    • Reading & Working with Geometry Files
  • Gallery
    • 3.75km MPAS Atmosphere Output
    • Visualizing MPAS Grid Topology
    • Plotting E3SMv2 Output with UXarray
    • Working with MPAS Grids
    • Analysis of E3SMv2 Model Output
  • API Reference
  • Tutorials and Videos
  • Cite Uxarray

Community

  • GitHub Discussions
  • GitHub Issues
  • UGRID Conventions
  • Contributor’s Guide
  • Repository
  • Suggest edit
  • Open issue
  • .rst

Gallery

Contents

  • Visualization Examples
  • Workflow Examples
  • External Examples

Gallery#

Visualization Examples#

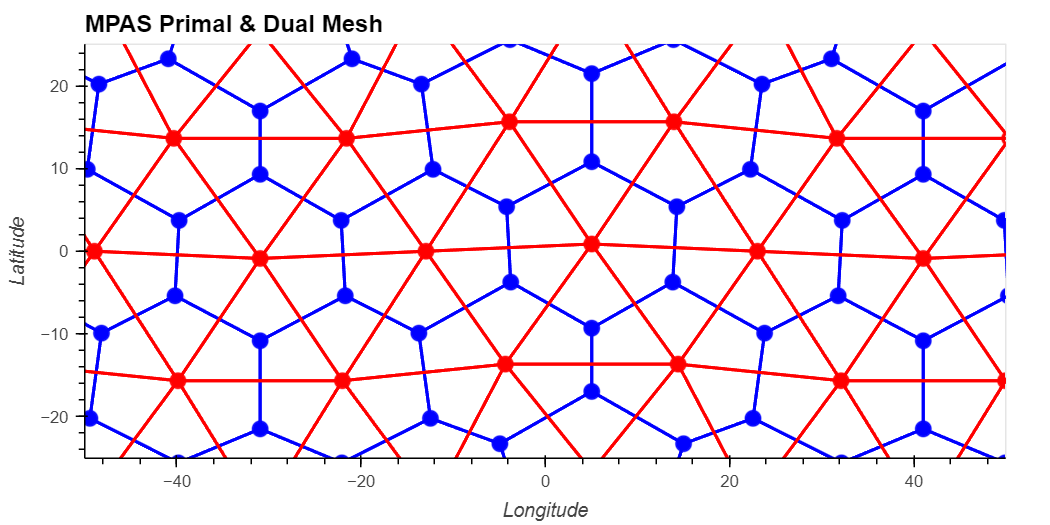
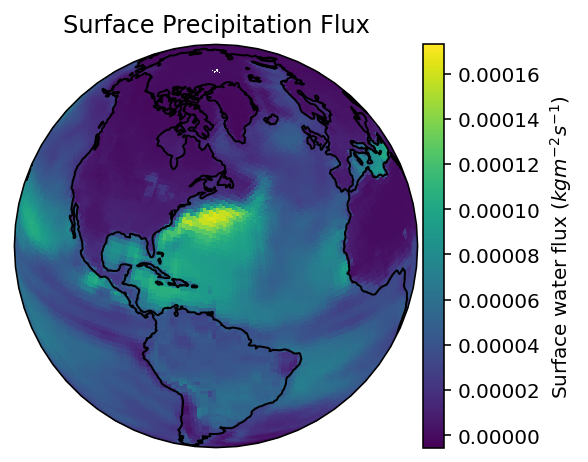
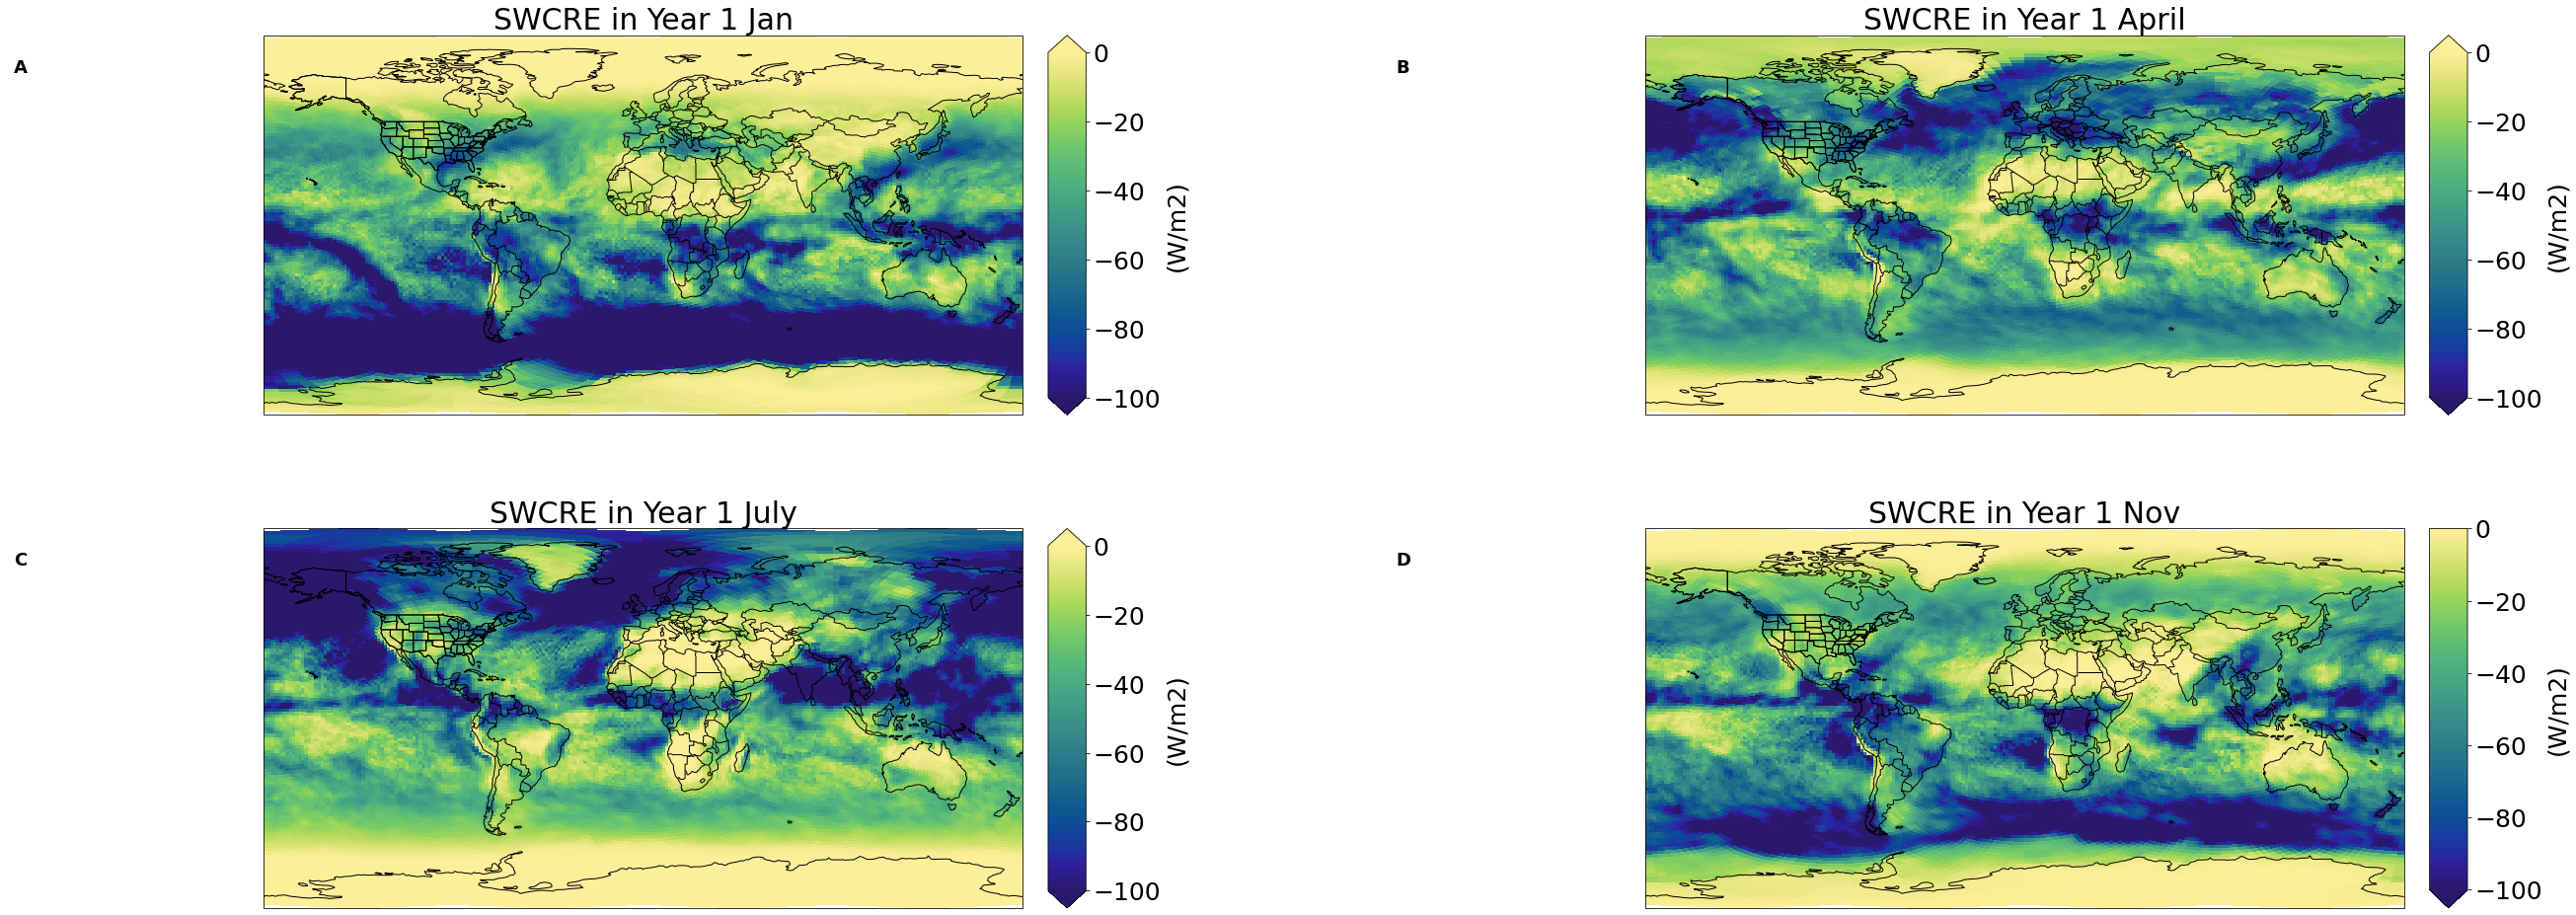
The following notebooks are a collection of one-shot visualization examples showcasing UXarray’s plotting functionality across various interesting datasets.

3.75km MPAS Atmosphere Output

3.75km MPAS Atmosphere Output

examples/visualization/3_75km_mpas.ipynb
Visualizing MPAS Grid Topology

Visualizing MPAS Grid Topology

examples/visualization/mpas_topology.ipynb
Plotting E3SMv2 Output with UXarray

Plotting E3SMv2 Output with UXarray

examples/visualization/e3sm-load-viz.ipynb

Workflow Examples#

The following notebooks showcase workflows of Uxarray in action.

Working with MPAS Grids

Working with MPAS Grids

examples/working-with-mpas-grids.ipynb
Radiative Feedback Analysis on E3SMv2 Model Output

Radiative Feedback Analysis on E3SMv2 Model Output

examples/e3sm-calc-workflow.ipynb

External Examples#

Additional examples that are not part of the official documentation.

Unstructured Grid Visualization Cookbook

Unstructured Grid Visualization Cookbook

https://projectpythia.org/unstructured-grid-viz-cookbook

previous

Reading & Working with Geometry Files

next

3.75km MPAS Atmosphere Output

Contents
  • Visualization Examples
  • Workflow Examples
  • External Examples

By UXARRAY

© Copyright 2026, UXarray.